Your Planets
Portraits of the Planets
Aspects between Planets
The planetary ages
The planetary families
Planets in Signs
The Planets in comics

In the Cahiers Conditionalistes No. 21 and 22 of the year 1993, I proposed the use of a new clue in global astrology (“Tell me why?”). The idea dates back to 1991 and I had shared it with Jean-Pierre Nicola. Originally, it was the use of declinations in global astrology by Gustave-Lambert Brahy, which pushed me to look in this direction. The desired objective is to simplify the reading of the astrologer’s charts, but how to achieve this? I know the work of Jean-Pierre Nicola and the improvements made by Richard Pellard, and I say to myself that it is possible to use the concentration-dispersion index of Jean-Pierre, known as “SAVA index”, for the distribution of variations.
Originally, I calculate an index for the period from 1986 to 2000 but I use a slightly different method (I used the sum of the intercycles rather than their increment) than the one used by Jean-Pierre and I obtain the graph following:
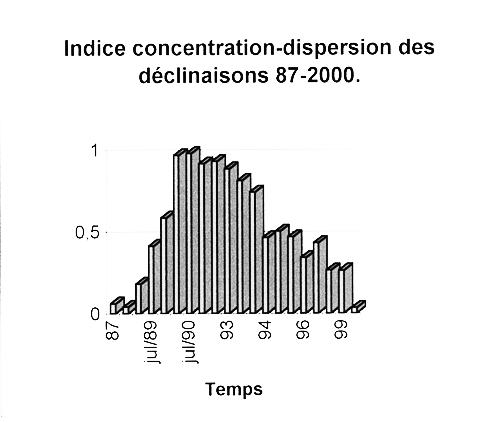
I will not pursue my investigations further, but the meager result obtained with this graph corroborates those obtained by Jean-Pierre Nicola with his index “SAVA” (Summation Advances Angular Velocities). The general appearance of the graph is consistent with the evolution of events that took place during this period on the planet (fall of the Berlin Wall, collapse of the Soviet empire, Gulf War, etc.).
Since then, I have continued my research on the whole of the 20th century and also over the period from 1980 to 2010. The method used to obtain this “declination concentration-dispersion index” is analogous, and the word is weak, to that used by Jean-Pierre Nicola.
▶ 1. The position, in declination, of the slow-moving planets is determined on a given date, the 1st January of each year, for example. Example:
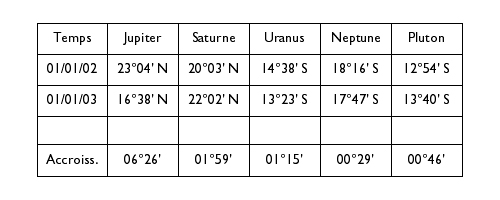
▶ 2. We then determine the advance traveled (increase) by each of the planets during a fixed time interval: month, quarter, semester, year or other. In our example, we see that the increase of the planets is 6° 26′ for Jupiter, 1° 29′ for Saturn, 1° 15′ for Uranus, 29′ for Neptune and 46′ for Pluto.
▶ 3. We calculate the increase, in absolute value, of each of the intercycles from Jupiter to Pluto, from Saturn to Pluto, from Uranus to Pluto and that of Neptune-Pluto and we obtain:
▶ Jupiter-Saturn = 4° 27′
▶ Jupiter-Uranus = 5° 11′
▶ Jupiter-Neptune = 5° 57′
▶ Jupiter-Pluton = 5° 40′
▶ Saturn-Uranus = 0° 44′
▶ Saturn-Neptune = 1° 30′
▶ Saturn-Pluton = 1° 13′
▶ Uranus-Neptune = 0° 46′
▶ Uranus-Pluton = 0° 29′’
▶ Neptune-Pluton = 0° 17′
The sum of all intercycle increments for the year 2002 is 26° 14′.
▶ 4. The applicable intercycles are then determined. An aspect, between two or more planets, is applied when the faster planet has passed the opposition aspect and is moving towards the conjunction of the other slower planet(s). An aspect is separating, when the faster planet moves away from the slower after the exact aspect.
During the year 2002, Jupiter applies Saturn, Uranus, Neptune and Pluto: that is, a total of the applying aspects for Jupiter of 21° 15′. Saturn separates from the other planets. Uranus applies Pluto, just as Neptune applies Pluto, giving Uranus and Neptune a total of 46′. The sum of the aspects applying for the year 2002 is therefore 22° 01′.
▶ 5. We then determine the ratio of the aspects applying A to the total of the aspects for the chosen period T, for example the year, and we proceed in this way for each of the chosen periods.
The A/T ratio varies, in theory, between 0 and 1. Below a value of 0.5, the planets are mostly in phase separation and above an A/T value = 0.5, there are more planets in application than in separation.
The areas of the graph obtained, above the value A/T = 0.5, correspond to the critical periods of the century, during which men tend to get excited more than usual. It includes, of course, the main wars and other economic crises.
When graph values are less than A/T = 0.5, a calm “relative” rules the planet Earth. Often, these periods are related to a certain economic, social and scientific development.
For the period relating to 20th century, I represented a jupiterian graph and a saturnian graph which does not integrate Jupiter.
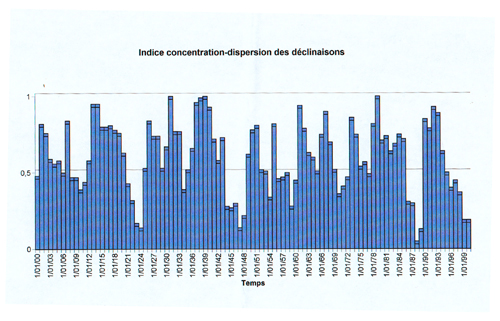
In the jupiterian graph, entitled Index concentration-dispersion of declinations, it is obviously Jupiter, the fastest planet of the 5, which mainly modulates this one. “What is fast is more present and actual than what is slow, and what is present is more political than philosophical.” The graph shown below follows the fluctuations of the jupiterian values ‘rE’ and it should, theoretically, be more representative of the struggles for power, authority, supremacy and order in contemporary society.
We obtain, for the period from 1900 to 2000, the following jupiterian graph:
The following graph is the saturnian graph of the ICD of declinations, for the last century.
This graph, of nature ‘tE’ (saturnian function), is characterized by smaller variations in its general appearance. It is distinguished by four highlights: 1903–1918, 1930–1944, 1960–1968 and 1974–1990. Modulated by saturnian fluctuations, this graph is representative of the slow and profound changes in our society. Certainly, the general shape of the saturnian graph is quite similar to that of the jupiterian graph, but the variations of the curve are less and they persist longer. Saturn’s impact should be much longer term than Jupiter’s, and its changes seem much more fundamental.
I also established for the period from 1980 to 2010, this double representation of Jupiter and Saturn.
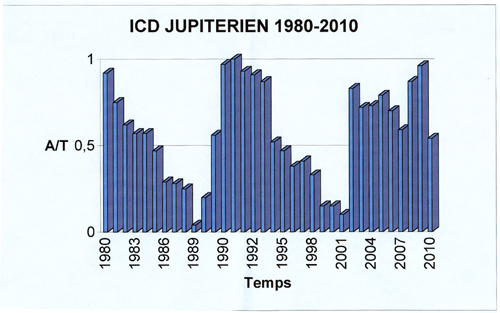
If we take into account the events that have taken place in recent years, we see, and this is logical, that the consequences of the events of 11/09/2001 have begun to manifest themselves more clearly (Jupiter obliges) in from the year 2002.
The highlights of this jupiterian graph are characterized by parallel aspects (same N or S declination) or counter-parallel aspects (same declination of the planets but in N and the other in S) between Jupiter and the four other planets.
The following graph represents the saturnian ICD graph for the period from 1980 to 2010.
As in the previous graph, the highlights are punctuated by the aspects of antiscissor or counter-antiscis between Saturn and the other three planets. The big difference results from the very nature of Saturn ‘tE’, planet of the long term, which marks changes whose effect has a more far-reaching effect.
The saturnian graph should concern changes in the essential values of society which often lead to a new growth in knowledge, for better or for worse.
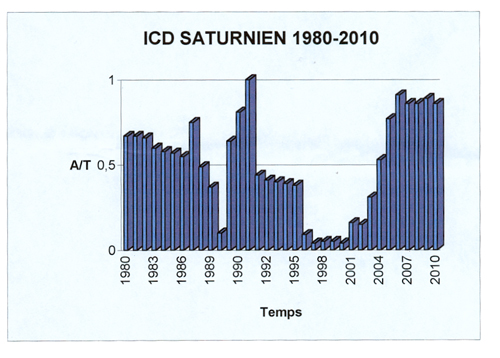
The general shape of the jupiterian and saturnian graphs suggests that we will not emerge from the current crisis before the end of the years 2009–2010. That said, we can think that these years could be conducive to scientific, medical and even astrological discoveries.
The big question that we can ask ourselves, after reading this article, what real use is this “concentration-dispersion index of the declinations of the slow planets”?
The answer to this question is twofold. First, it confirms the validity of the index “SAVA” by Jean-Pierre Nicola and on the other hand, as Jean-Pierre rightly says, “the attractiveness of variations is the introduction of an objective quantity (as much as speeds) and geocentric. This should make it possible to control or to have a more precise idea of the effectiveness of the zodiac of the declinations which groups the signs by families of four (equinoctial, central, solstitial).”
The technique used here is based on the qualitative criterion of separation (the fastest planet moves away from the slowest) and vice versa, on that of application (inverse phenomenon). The quantitative criterion is obviously that of the declination of the slow planets, from Jupiter to Saturn. It is almost certain that the use of the planet Mars in the ICD index of declinations would provide additional details, I did not do so, for lack of time and courage.
It is also indisputable that the study of this “declination concentration-dispersion index” could be refined. One could, for example, study the variations of these indices over a monthly, quarterly or half-yearly time interval. The technique would certainly be greatly improved by attributing an orb to the antiscis or counter-antiscis aspects which would make it possible to highlight the real duration of these, but in this case there would also arise the problem of the magnitude to be attributed to these orbs.
It would also be necessary to use for each cycle a specific recovery coefficient (l/g ratio, for example) and we could perhaps discover new avenues of research. The field of investigation of this index is still vast and even if that relating to the ICD of the declinations of slow planets turns out to be sterile, it is not forbidden to think that it will open the way to other research in global astro.
Bibliography
▶ The key to forecasting world events and economic and stock market fluctuations. Gustave-Lambert Brahy. Traditional Editions 1989.
▶ Dictionnaire astrologique. Henri.-J. Gouchon. Editions Dervy 1992.
▶ L’astrologie, André Barbault, interview with Michèle Reboul. Pierre Horay 1978.
▶ L’Astrologie mondiale. André Barbault. Fayard 1979.
▶ L’Astrologue No. 37 & 42 (1978).
▶ Cahiers Conditionalistes 21/22. L’Histoire au point, Anthologie astrologique, J.-P. Nicola.
▶ Les méthodes prévisionnelles. J.-P. Nicola. C. C. No. 3.
▶ La théorie des déterminations astrologiques of Morin de Villefranche. H. Selva. Traditional Editions. 1984.
▶ Opposition No. 2. J.-P. Nicola. Comac 1996.
▶ Opposition No. 1. André Barbault, 1974.
Article published in issue No. 19 of the Fil d’ARIANA (April 2003).
▶ Global astrology: a method
▶ Declination concentration-dispersion index
▶ Could astrology predict the stock market crash of October 2008?
▶ Élizabeth Teissier’s avian flu
▶ Conditioning in global astrology
▶ Élizabeth Teissier, Pluto in Scorpio & the AIDS epidemic
▶ Thoughts on global astrology
Les significations planétaires
par
620 pages. Illustrations en couleur.
La décision de ne traiter dans ce livre que des significations planétaires ne repose pas sur une sous-estimation du rôle des Signes du zodiaque et des Maisons. Le traditionnel trio Planètes-Zodiaque-Maisons est en effet l’expression d’une structure qui classe ces trois plans selon leur ordre de préséance et dans ce triptyque hiérarchisé, les Planètes occupent le premier rang.
La première partie de ce livre rassemble donc, sous une forme abondamment illustrée de schémas pédagogiques et tableaux explicatifs, une édition originale revue, augmentée et actualisée des textes consacrés aux significations planétaires telles qu’elles ont été définies par l’astrologie conditionaliste et une présentation détaillée des méthodes de hiérarchisation planétaire et d’interprétation accompagnées de nombreux exemples concrets illustrés par des Thèmes de célébrités.
La deuxième partie est consacrée, d’une part à une présentation critique des fondements traditionnels des significations planétaires, d’autre part à une présentation des rapports entre signaux et symboles, astrologie et psychologie. Enfin, la troisième partie présente brièvement les racines astrométriques des significations planétaires… et propose une voie de sortie de l’astrologie pour accéder à une plus vaste dimension noologique et spirituelle qui la prolonge et la contient.
Téléchargez-le dès maintenant dans notre boutique
Pluton planète naine : une erreur géante
par
117 pages. Illustrations en couleur.
Pluton ne fait plus partie des planètes majeures de notre système solaire : telle est la décision prise par une infime minorité d’astronomes lors de l’Assemblée Générale de l’Union Astronomique Internationale qui s’est tenue à Prague en août 2006. Elle est reléguée au rang de “planète naine”, au même titre que les nombreux astres découverts au-delà de son orbite.
Ce livre récapitule et analyse en détail le pourquoi et le comment de cette incroyable et irrationnelle décision contestée par de très nombreux astronomes de premier plan. Quelles sont les effets de cette “nanification” de Pluton sur son statut astrologique ? Faut-il remettre en question son influence et ses significations astro-psychologiques qui semblaient avérées depuis sa découverte en 1930 ? Les “plutoniens” ont-ils cessé d’exister depuis cette décision charlatanesque ? Ce livre pose également le problème des astres transplutoniens nouvellement découverts. Quel statut astrologique et quelles influences et significations précises leur accorder ?
Enfin, cet ouvrage propose une vision unitaire du système solaire qui démontre, chiffes et arguments rationnels à l’appui, que Pluton en est toujours un élément essentiel, ce qui est loin d’être le cas pour les autres astres au-delà de son orbite. Après avoir lu ce livre, vous saurez quoi répondre à ceux qui pensent avoir trouvé, avec l’exclusion de Pluton du cortège planétaire traditionnel, un nouvel argument contre l’astrologie !
Téléchargez-le dès maintenant dans notre boutique